Abstract: The recent
growth of the new governance indicators requires a discussion about
misconceptions when transposing means and goals of business administration to
the public sphere. For this purpose, the public value theory can provide a
neutral perspective for current studies on public governance, which implies the
need for reassessing some of the former indicators. In this paper, we
demonstrate the feasibility of this theoretical construction and propose a
quantitative multidimensional indicator for the state-level public finance in
Brazil. Based exclusively on the fulfillment of legal requirements, a 15-year
sample of all Brazilian states brought results different from the previous
findings. They revealed that the quality of governance is uncorrelated with
wealth, breaking the inequality assumption that rich states perform better than
the poor ones.
Keywords: Public Governance;
Public Finance; Governance Indices; Public Value.
Resumen: La reciente proliferación
de nuevos indicadores de gobernanza hace necesaria una discusión sobre
conceptos erróneos al transponer los medios y objetivos de la administración de
empresas a la esfera pública. En este escenario, la teoría del valor público
puede proporcionar una perspectiva neutral para los estudios actuales sobre la
gobernanza pública, lo que implica la necesidad de reevaluar algunos de los
indicadores anteriores. En este trabajo, demostramos la viabilidad de esta
construcción teórica y proponemos un indicador cuantitativo y multidimensional
para las finanzas públicas a nivel estatal en Brasil. Basado exclusivamente en
el cumplimiento de los requisitos legales, una muestra de 15 años de todos los
estados brasileños arrojó resultados diferentes a los hallazgos anteriores.
Revelaron que la calidad de la gobernanza no está correlacionada con o nivel de
riqueza, rompiendo el supuesto de desigualdad de que los estados ricos
funcionan mejor que los estados pobres.
Palabras clave: Gobernanza pública;
Finanzas públicas; Índices de Gobernanza; Valor Público.
Resumo: A recente proliferação
de indicadores de governança reconduz à discussão acerca da transposição de
meios e fins da administração de empresas para a esfera pública. Neste cenário,
a teoria do valor público pode fornecer uma perspectiva neutra para os estudos
atuais sobre governança pública, implicando na necessidade de reavaliação de
alguns indicadores previamente elaborados. Neste artigo, demonstramos a
viabilidade dessa construção teórica e propomos um indicador quantitativo e
multidimensional para as finanças públicas estaduais no Brasil. Com base
exclusivamente no cumprimento de requisitos legais, uma amostra de 15 anos de
todos os estados brasileiros trouxe resultados diferentes dos achados
anteriores. Eles revelaram que a qualidade da governança não é correlacionada
com a riqueza, quebrando a suposição de desigualdade de que os estados ricos
têm um desempenho melhor do que os estados pobres.
Palavras-Chave: Governança Pública;
Finanças Públicas; Índices de Governança; Valor Público.
Introduction
During the second half
of the 20th century, Latin American countries and governments faced several
social and economic difficulties. After the democratic transition, the recently
established democratic governments were pushed by their citizens to play more
active roles in economy, taking into account social aspects and the redistributive
functions in their activities. On the other hand, they were not able to increase
their public spending, given their inability to raise taxation levels (Tanzi,
2008).
Due to evident exposure
to European influences, these countries have developed policies that protect
individuals “from the cradle to the grave”. Although the extension of this
assistance may vary within each region, these programs usually include public
pensions, public health programs, free public schools, subsidies to large
families, unemployment compensation, support for disabled people, and public
housing (Tanzi, 2008, p.9).
The recent pursuit of better
private managerial methods, roughly applied to public services, increased the
perception that the public sector staff does not have the ethos they
once had. This idea might be associated with the narrow focus on performance
indicators, the lack of responsiveness to public value concepts, and the
failure to assess the impact of the service deliverance on the communities
(Blaug, Horner and Lekhi, 2006, p.26).
In a context of significant
social and economic inequalities, Brazil is currently exposed to a widespread
discourse of good governance, and policies and managerial models, whose results
do not seem to be positive though – at least for the population. In order to
tackle this issue, it is fundamental to revisit the origins of a genuine governance
for the public resources, and then draw the bases for indicators and subsequent
indexes, to measure what they propose: governance in public administration
(Hood, 2012).
In addition to that, the
welfare of the citizens of a country is linked to values of socio-economic
indicators. Governments try to influence them through their spending policies,
indicating the pursuit of a public value notion.
This paper estimates a
governance indicator by using budgetary and financial variables to evaluate the
governmental performance, according to the public value perceived by citizens.
It provides a new tool for state-level governments to assess their financial
performance. On that account, it works as “a measurement framework (...) [that]
enables politicians, managers and the public to recognise when and the extent
to which such value is being created.” Furthermore, it contributes to the
advance of knowledge by expanding the theoretical comprehension of public
value, quantitatively applied to subnational governments in Brazil. (Blaug et
al., 2006, p.60).
This article is divided
into five parts. The first one is the introduction, which is followed by a theoretical
framework. The third part comprises the methodology for the indicator assessment,
and the fourth presents the results and main achievements. Finally, in the
fifth section, we conclude and offer some final remarks.
Theoretical Background:
Public management is a
topic often approached in papers on organizational theory and economics, but little
mentioned in finance studies. As this paper establishes a cutoff point between
private managerial methods and commonly discussed public service theories, it
seems proper to review the most traditional theories, and if and when they are applied
to public finances. The following sections examine central aspects of some of
the recently adopted theories and conclude that they are useful for Brazilian
studies on the public sector. We expect the reader to assume that we do not
endorse any particular point of view as right or wrong. On the contrary, they
can complement each other to develop the public administration.
From the Hobbesian government
to the rule of law in a fiscal state: the reason for public finance rules
The Hobbesian writings
assert that a government, or any authority, is the only alternative to anarchist
chaos, or natural state, via monopolization of the use of coercive power,
avoiding the war of all against all. For that reason, a State should
have the freedom of a coercive power in the hands of a sovereign, and the
complete freedom would be named order (Hobbes, 1651/1998; Brennan,
Buchannan, 1980).
The Hobbesian approach to
coercive power can be divided into two different branches. The first one, from
now on referred as the fiscal state, derives directly from the means necessary to
fund this state, “concerning the treasure, as tributes, impositions, rents,
fines, or whatsoever public revenue, to collect, receive, issue, or take the
accounts thereof” (Hobbes, 1651/1998, p.341). Brennan and Buchanan (1980, p.
11) argue that, for an ordinary citizen, “the power to tax is the most familiar
manifestation of the government’s power to coerce” and involves the imposition
of charges that are only fulfilled by transferring economic resources to the government.
In addition, Oliveira (2009) highlights that any attempt to measure the economic
and social effects of the fiscal policy should consider the mechanisms that the
state uses to obtain resources; the force of the government-governed
relationship, as people provide the state with the power to tax; and the
principles that guide the loss distribution among taxpayers, as well as the
benefits for the whole society (Oliveira, 2009, p.81).
The second branch, which
we nowadays call the rule of law, is the indistinct application of the rules to
the ruled ones. Despite Hobbes’ arguments against the inclusion of the state
(or the sovereign) in the rule of law, the later evolution of this idea,
especially after Kant, led to the conclusion that the state has the moral
obligation to obey it, at least.
The rule of law can be
defined as a publicly available written law, promulgated by an authority before
the events that it regulates, and fairly applied to relevant state institutions,
including the judiciary. By fairly, it should be understood that the law
must have similar effects for equivalent cases, regardless of the class,
status, power, or any other attributes of each one of the parties involved. It
should also allow each party to be equally voiced (O’Donnell, 2004, p.33). Any
eventual deviance from this standard might indicate the absence of the rule of
law, sometimes replaced by cases constructed as ruled by law. Two
possibilities arise from this scenario. The first one is the violation of the
international moral standards that countries are pushed to agree to and write
in their constitutions. The second is the disrespect for a fundamental notion
of fairness and equity, according to which, cases alike should not have
different consequences; otherwise the responsible authorities would not feel
obligated to make similar decisions in future occasions (O’Donnell, 2004,
p.34).
Furthermore, Fuller
broadens the definition of the rule of law to a moral issue, enforcing the
congruence between the official action and the declared rules. In other words,
“the respect of citizens and the state for the institutions that govern […]
social interactions among them” is referenced as one of the branches of
governance.(Kaufmann, Kraay, Mastruzzi,
2011, p.222).
About public governance
On the second half of
the 20th century, governance emerged as a critical challenge for academics. The
post-Second World War context and the transformation of the former western
welfare conception required a new comprehension of the theory, practice, and
dilemma of the new societal construction and its “constantly shifting and
contingent nature of practical political activity” (Zumbansen, 2012; Bevir,
2010, p.11).
When applied to public
issues, governance can be defined as the formal and informal arrangements that shape
public decision-making. It can also be understood as the way public actions are
guided, in a perspective of keeping constitutional values, in the face of constantly
changing problems, environments, and agents (OECD, 2005, p.16).
Policy-makers widely use
the term governance in the attempt to improve the living conditions of people in
poverty and oppression situations. Due to its ambiguity, the concept can be
easily reshaped according to the preferences of each author. In this sense, one
must be aware that, while the understanding of governance may be enhanced, the extent
of uses can obfuscate its meaning (Peters, 2012). In its original form, governance
refers to the “collective choices that cannot be addressed adequately by
individual action”, and the search for proper means to make decisions. Thus, governance
embeds some accountability concepts, once the agents involved in this
decision-making are supposed to be held accountable for the actions. (Peters,
2012, p.20).
Chan and Xiao (2009) mention
that financial management is a critical point for assessing a government’s
ability and capacity to deliver services (and by extension, goods, according to
Musgrave’s definition). So, a financial manager is responsible for keeping “a score
of finance-related exchanges, advis[ing] management on the terms of those
exchanges, and monitor[ing] financial performance of all the parties concerned”,
and for watching the viability of the institutional network and its
participants, including contractual performances (Chan and Xiao, 2009, p.115).
Feldman and Khademian
(2002) propose an alternative view on the governance issue. In contrast to the
principal agent relations, they discuss the structure of the interactions
between the parts, which are determined by constitution, statutes, custom, and
practice. These principal-agent relations determine what actions are enabled or
constrained. In other words, they regulate who can participate in the decision-making.
From this point of view
“the public
manager’s responsibility rests not only with the policy outcomes, but making
visible and continuously evaluating the appropriateness of the nature and
quality of the relationship structures they create and recreate through their
actions” (Feldman and Khademian, 2002, p.545)
As a financial extension
of the governance model, Stoker (2006) defines the public value management paradigm
as a thesis-antithesis-synthesis result from the previous new public financial management,
but with the comprehension of its narrow utilitarianism.
In order to put the
public management principles back to action, Stoker (2006, p.47) reminds us that
public affairs are considerably different from the commercial sector
activities. As “governing is not the same as […] buying and selling goods in a
market economy”, some of the prescriptions of the new public management are not
appropriate to a public experience.
To challenge the traditional
public administration and new public management, public value is defined by
Constable, Passmore, and Coats (2008) as a broad approach to thinking about
public administration and continuous improvement in public services. For this study,
we chose to follow the original perspective of Moore (1995), which accepts a
concept of value more extent than the economic sense, and which is appraised according
to what citizens consider valuable.
This evaluation requires
the public to participate in the decision-making processes, in a representative
democracy enabled by the managers. They shall facilitate this procedure by developing
powers and emphasizing the representative role of the elected members, thus gaining
strength from the active involvement of the community (Blaug et al.,
2006, p.19). According to Moore (2003), “the ultimate value [...] can be
measured by the satisfaction and benefits it delivers to its clients, or by the
social results that it produces for the society at large”. As an additional
note, these organizations should satisfy their customers, or citizens, in the
case of public entities, and help them to change their lives and achieve the
desired social outcomes.
As Blaug et al. (2006)
remark, although goal-directed models have brought an image of rational
management to government organizations, they often ignore the impacts on
operational activities. This negligence requires the use of a multi-dimensional
approach to measuring performance in the public sector (Blaug et al.,
2006, p.56; Modell, 2004).
In spite of all
traditional methods of measuring government performance, Blaug et al.
(2006) remind us of this:
“the goal of
public management in a public value framework is to ensure that organisations
are more responsive to what the public wants and needs. […] In this respect, it
moves away from narrow conceptions of performance management or economic
evaluations that attempt to sum the social, economic or environmental impact of
an institution, towards an analysis of the capacity of organisations to deliver
public value”. (Blaug et al., 2006, p.56).
The capacity, however,
should be defined within the framework proposed by Matthews (2012). According
to the author, the governance approach, in its third wave, highlights “the
prevailing influence of governing norms and traditions, and how they have
affected the capacity of states to respond to the challenges associated with
the governance narrative” (Matthews, 2012, p. 282).
More than a simple
definition, the public value also provides a “guiding concept” for theorists
and practitioners of public administration. Among the many definitions it has gained
in the last ten years and given the complete absence of consensus among the
authors, two independent schools use it as the core of their studies (Meynhardt,
2009; Rutgers, 2015).
The first school has its
roots in Moore’s Creating Public Value (1995), and it is centered on
Public Value Management. With an approach that ensures that public value is the
next step after the new public management, this result-oriented school moves
away from the state-versus-market perspective. On the other hand, Bozeman
(2002, 2007) opposes the concept of public values to the dominant economic
approaches for public policy analysis, focusing on and giving birth to the analysis
of public value failure. According to the author, the public values of the
society provide normative consensus about citizens’ rights and benefits,
obligations to the society and the state, and the principles on which
governments and policies are based (Bozeman, 2007, p.13).
Alternatively, there are
attempts to define public values by their differences to the public interest,
although circularity has been typically observed in these cases. On that
account, the concept of public benefit has also been discussed as a
tendency of recent literature to concentrate on which benefits people can take
from public actions (Alford and O’Flynn, 2008; Meynhardt, 2009; Rutgers, 2015).
Jørgensen and Bozeman
(2007) address two main points in the attempt to define public value: what the
values referred by the authors when they write about public values are; and
then, what issues should be analyzed. After an extensive literature review, the
authors have identified two central tendencies. The first one tackles the
recent public sector reforms as new public management practices or government
reinvention. The second – an emerging trend – focuses on former public values
of public administration, launching new progressive models, such as new public
governance or new public service.
After obtaining a sample
of 72 registered values, Jørgensen and Bozeman (2007, p.359) grouped different
concepts of public value, creating a structure in which citizens are in “the
environment”, and do not belong to the “society at large”. In this sense, the understanding
that citizens should be equal parts of a system is closely related to the core
concept of public value, summarized by Jørgensen and Bozeman (2007,
p.361), as the
“[…] idea
that the public sector should create or contribute to the common good and to
the public interest. Critics often call these concepts insubstantial and
worthless. What exactly does the common good or the public interest mean? […]
The public sector must not serve special interests, it must serve society as a
whole; the public sector is there for everybody, it is not the extended arm of
a particular class or group”. (Jørgensen and Bozeman 2007, p.361).
Several different
attempts were made to establish quantitative parameters for measuring the results
of the public sector activities. However, there are two distinct and
complementary criticisms to the performance measurement in the public sector.
The first one states that governments do not measure the right variables,
although they assess too many features. The second one points out a failure in
identifying long-term issues of the strategic planning of public entities.
According to this point of view, practices of performance measurement tend to
be broad and unfocused, which leads to an enormous failure to provide public
services (Atkinson, Waterhouse, and Wells, 1997; Chow, Ganulin, Haddad, and
Williamson, 1998; Modell, 2004).
In order to avoid these
mistakes, this analysis aims to measure the governance as the value perceived by
each Brazilian citizen, without any distinctions, through the compliance with
the existing laws for state-level public finance in Brazil, which have barely changed
since 2000. Thus, our attempt overcomes previous issues by measuring the best
variables available, as well as covering an extended time frame to identify
long-term matters of the strategic planning. The procedures are detailed in the
next section.
Methodology
Decision-making on
public expenditure and the necessary resources for governmental action are not a
merely economic matter, but a political one as well. They reveal a conundrum of
social forces developed by classes and shape the way a government will act. In
other words, “The budget is a mirror of the political life of a society, since
it registers and reveals which class […] pays more taxes, and which ones obtain
more benefits from the expenditure”, in a process that the society decides, via
their representatives, the goals for public expenditure and their corresponding
financial sources, and the methods for the effective control of actions (Oliveira,
2009, p.87).
According to Mikesell
and Mullins (2011, p.4), the budgetary process lies in the heart of politics.
Therefore, as the connections between technical and political aspects of
budgeting systems are not well defined, it is convenient to establish, as a
starting point, that the public sector did not change the function of the
budget in the last decades.
Budgetary data were collected
from the official websites of the legislative assemblies, government secretary
offices (Civil Office, Civil House or equivalent), planning secretaries, finance
departments (Treasury or equivalent), and from the official journals of the
states. Financial
data were collected from the National Treasury Secretary, from four
national databases – SISTN (Sistema de Coleta de Dados Contábeis dos Entes
da Federação), FINBRA (Finanças do Brasil), SICONFI (Sistema de
Informações Contábeis e Fiscais do Setor Público Brasileiro), and from the
Federal Treasury itself.
With 15 annual
observations between 2000 and 2014 for each one of the 27 federative units, the
variables collected and the corresponding sources are shown in Table 1, in
order to build a compound or multidimensional indicator.
A multidimensional
indicator gathers different units of analysis in one single measurement. It
uses a standardized method and ideally should allow a self-assessment. First,
we established how to set the weights for the indicator, which we called governance
intensity. After that, the scores were weighted up by the Brazilian population,
resulting in the governance incidence. At last, we determined the testing
conditions for reliability and internal consistency.
The concept of
governance intensity we used emerges from two different sources. The first one,
the Oxford Poverty and Human Development Initiative, uses the intensity concept
directly applied to poverty to measure the degree to which people are poor in
multiple dimensions, and not only to quantify the individuals that can be
considered poor. Mostly based on the Alkire-Foster method, we call governance intensity
the extent to which each state can be evaluated in five different dimensions.
In addition to that, the governance incidence estimates the proportion that the
intensity is observed across the country (Alkire, Foster, Seth, Santos, Roche,
Ballon, 2015).
Table
1 - Variables, sources, dimensions, divisions,
and scoring equations
|
Variable
|
Source
|
Dimension
|
Division
|
Scoring equations
|
|
Description
|
Weight
|
Description
|
Weight
|
|
|
Budget law enactment date
|
State budget laws
|
1 – Budget cycle regularity
|
0.2
|
-
|
0.2
|

|
|
Current revenue
|
Balance sheets
|
2 – Current budget balance
|
0.2
|
-
|
0.2
|

|
|
Current expenditure
|
|
Interest on debt
|
National Treasury Secretary
|
3 – Debt management
|
0.2
|
3.1 – Interest-to-expenditure rate
|
0.1
|

|
|
Consolidated net debt
|
3.2 - Consolidated net debt to Real Revenue
|
0.1
|
|
|
Real expenditure
|
4 – Planning accuracy
|
0.2
|
4.1 – Revenue accuracy
|
0.067
|

|
|
Real revenue
|
4.2 – Expenditure accuracy
|
0.067
|

|
|
Planned expenditure
|
State budget laws
|
4.3 – Surplus or deficit
|
0.067
|

|
|
Estimated revenue
|
|
Education expenditure
|
National Treasury Secretary
|
5 – Attendance to legal minimum percentage
allocations
|
0.2
|
5.1 – Education
|
0.1
|

|
|
|
|
|
|
|
Health expenditure
|
5.2 – Health
|
0,1
|

|
|
|
|
|
|
|
|
|
Using a method provided
by Decanq and Lugo (2008), this indicator had its dimensions equally weighted
at 20% each, making up the total weighting of 1, and not allowing negative
weights. Some of these dimensions were split again, keeping the criterion of equal
weights within each dimension. The equations in Table 1 equalize all scores in
order to generate values ranging from 0 to 1 in each dimension.

Taken from the annual budgetary
allocation and financial spending, the financial variables can reveal a pattern
of governmental response to the collective demand. Available data will be analyzed
under the perspective tested by Rubin and Willoughby (2009). The methods proposed
by them evaluate the practical use of the North American Financial Government
Performance Project (GPP), which consider four different evaluation criteria to
produce a grade for financial management.
The first dimension (A)
is the regularity of the budget cycle, as required by the article 34 of the
Federal Law 4.320/64 (Brasil, 1964). To obtain the ratings, every annual budget
law was awarded the maximum score, if the budget was enacted before the first
day of the fiscal year, January 1st. In case of delay, a reduction
of 1/365 per day was imputed.
The second dimension
(B), the balance of current budget, comprises the capacity of the states to
sustain current expenditures with current revenues of the same year, as specified
by the article 11 of the Federal Law 4.320/64. States that have fulfilled this
requirement received grade 1; those who have not were given decreasing rates,
according to the percentage of the revenue deficit.
The third dimension (C)
refers to the debt and comprises two divisions. The first one relates to the
payment of interest debts that were deducted from the maximum score, proportionally
to their impact on the total expenditure of the states. The second division of
the debt comprehends the ratio of current net debt to current net revenue of the
states. According to the Resolution 40/2001 of the Senate (Brasil, 2001), this
ratio should not exceed 2. Therefore, as the ratio approaches the maximum
limit, the scores tend to 0.
The fourth dimension (D)
is the accuracy of planning, subdivided into three equally weighted values,
according to the Annex 12 of the Federal Law 4.320/64. The first one (D1)
concerns the precision obtained when planning the expenditure. In this case, the
percentage of discrepancy between the planned and realized values is deducted
from the maximum score of 1. Similarly, the second condition (D2) is
applied to the accuracy of revenue. Finally, the accuracy between revenue and
expenditure (D3) makes up the third dismemberment of the accuracy planning.
The fifth dimension (E)
is defined as the constitutional minimum percentage of expenditure in education
(25%) and health (12%), represented by the divisions E1 and E2,
respectively. Compliance with the minimum value determines the maximum grade, while
non-compliance follows the highest score, proportional to the expenditure not
made in their functions (Brasil, 2000).
After using the
collected data in the corresponding equations, as described in Table 1, the
states obtained an annual score for each dimension, which scales the intensity
of the governance practiced.
Thus, the governance
intensity in each state can be determined annually by the Equation 1, wherein
each one of the values in the brackets represents the corresponding dimension
(or partition, in due cases) in Equation 2. They are detailed in Table 1.

After measuring the governance
intensity for each Brazilian state, the next step was to investigate how
citizens perceive this governance. The governance incidence is the result of
the weighted sum of the intensity. As weights, we determined the proportion of the
population living in each State, by year, as presented in Equation 3:

The underlying concept of
this intensity is the neutrality of the law, which refers to every citizen as
an equal part of the country. Thus, it is convenient to define the same weight
to each citizen, instead of ranking the states and verifying relative
advantages among them.
The reliability of the
indicator proposed was assessed via two measurements. In the first one, we
checked the internal consistency of the values obtained, by using a correlation
matrix for the indicator and its dimensions. The absence of correlation among
the dimensions revealed that they are independent of one another; while
correlations between the dimensions and the total governance intensity meant
that the components were significant. After checking the internal consistency,
the external validity was assessed by comparing the results to those provided
by the two previous attempts to measure subnational governance in Brazil, also using
correlation matrices. In the next section, the results of these procedures are better
detailed.
Results
Measuring the governance
intensity brought a deeper comprehension of public issues. The first dimension,
regularity of the budget cycle, revealed decreasing grades. Although the scores
might seem high – as the mean is still close to 1 – only six states rigorously followed
the legal schedule every year, and approximately 63% of the budget laws were
approved on time.
The results in Table 2
reveal that the budget enactments in the last year of the sample were one week
later in comparison with the first year. This decrease has two complementary
reasons. First, between 2000 and 2014, the budget enactment delay became, on
average, two days longer, when considering all states (scores of 0.987 and
0.981, respectively). Second, the number of states that started the fiscal year
with an enacted budget law dropped from 21 to 14, which represents 1 out of 3
states. In other words, more states were behind schedule, and the traditionally
late ones were even more delayed.
Several consequences
arise from the belated enactment of the budget law. Following a pattern
established at the federal level, most states use the previous year as the main
reference for cases in which the budget is not enacted on schedule. In these
conditions, states are allowed to spend only one-twelfth of the previous year’s
amount for non-compulsory expenses. As most representative functions are exempt
from this rule (including education and health), most investments and long-term
oriented policies face serious risk in this budget limbo.
The second dimension, the
balance of the current budget, comprises the capacity of the states to sustain
current expenditures with current revenues for the same year, as referred in
article 11 of Federal Law 4.320/64.
The superiority of the current
revenues over current expenditures showed the best scores of the entire sample.
Only seven states operated in deficit between 2000 and 2014. Paraná, Goiás,
and Piauí ran only one year in deficit (2000, 2001, and 2003,
respectively), while Minas Gerais (2001 and 2002) and Rio de
Janeiro (2012 and 2014) faced two years in deficit each. Furthermore,
the recent evolution of Rio Grande do Sul and São
Paulo urges a more in-depth analysis, since they hold the worst
performances for this dimension (3 years in deficit each).
The dangerous fiscal
condition of these two states could be easily verified through empirical means.
Among massive salary retains, civil servant strikes, and repression of student
movements against school closings, the executive actions taken by these states revealed
how critical their condition was in 2015.
Table 2 - Highlighted results of governance intensity
in Brazilian states, by dimension and divisions, in 2000-2014
|
Intensity, dimensions, and divisions
|
Variables
|
|
Mean Value
|
Higher averages (state)
|
Lower averages (state)
|
Best annual performance
(state:year)
|
Worst annual performance
(state:year)
|
|
Governance intensity
[(A+B+C+D+E)/5]
|
0.91
|
0.96 (AP)
|
0.85 (AL)
|
0.99 (AP: 2009)
|
0.72 (MA: 2000)
|
|
Dimension A – Budget cycle regularity
|
0.98
|
1.00 (AC, AM, MS, PE, PR, RS)
|
0.92 (ES), 0.94 (AL), 0.95 (RN)
|
1.00 (255 observations)
|
0.44 (ES:2003)
|
|
Dimension B – Current budget balance
|
0.99
|
1.00 (20 states)
|
0.98 (RS)
|
1.00 (392 observations)
|
0.88 (PR:2000)
|
|
Dimension C – Debt management
|
Dimension C
|
0.75
|
0.95 (AP)
|
0.49 (RS)
|
0.99 (AP:2008)
|
0.46 (AL:2002)
|
|
Branches
|
C1
|
0.97
|
0.99 (AP)
|
0.94 (RJ)
|
1.00 (RR:2012)
|
0.91 (SC:2012)
|
|
C2
|
0.54
|
0.92 (AP)
|
0.00 (RS)
|
0.95 (RN:2012)
|
0.00 (RS: 2000-2014)
|
|
Dimension D – Planning accuracy
|
Dimension D
|
0.91
|
0.96 (RS)
|
0.79 (RR)
|
1.00 (RS:2009)
|
0.52 (RR:2011)
|
|
Branches
|
D1
|
0.89
|
0.96 (RS)
|
0.73 (RR)
|
1.00 (BA:2007)
|
0.35 (RR: 2011)
|
|
D2
|
0.9
|
0.96 (RS)
|
0.79 (RR)
|
1.00 (RS:2012)
|
0.37 (DF:2003)
|
|
D3
|
0.95
|
1.00 (SP)
|
0.86 (RR)
|
1.00 (SE:2004)
|
0.46 (RR:2011)
|
|
Dimension E – Attendance to legal minimum percentage allocations
|
Dimension E
|
0.89
|
0.98 (SP)
|
0.76 (ES)
|
1.00 (CE:2001-2011)
|
0.38 (PE:2000)
|
|
Branches
|
E1
|
0.81
|
0.88 (SP)
|
0.42 (ES)
|
1.00 (CE: 2001-2011)
|
0.30 (PI:2008)
|
|
E2
|
0.96
|
1.00 (AC, AL, BA, DF, PR, RN)
|
0.83 (RJ)
|
1.00 (AC, AL, BA, DF, PR, RN: 2000-2014)
|
0.12 (MA:2000)
|
Note: The complete tables and results are
fully available upon request.
The government of São
Paulo issued the Decree n. 61.131 in February 2015 to cut 5% to 10% of
the then current expenditure, which provided some temporary relief. However,
the first project for the 2017 budget law brought an estimated revenue significantly
smaller than the expected.
Similarly, Rio Grande
do Sul reduced around 21% of its current use expenditure (São
Paulo, 2015; Rio Grande do Sul, 2015), but without achieving the same temporary
relief as São Paulo. Street protests and civil servant strikes anticipated the
Decree 53.303, which made official the financial calamity state, in November
2016.
The third dimension, the
debt, comprises two divisions. The first one relates to the payment of interest
debts, which were deducted from the maximum score, proportionally to their
impact on the total expenditure of the states. The second one is the ratio of
current net debt to current net revenues.
The allocation of
expenses for the payment of debt interest shows that, on average, states used
3.3% of their resources for this purpose. The annual evolution of the joint
performance of the states revealed significant improvement. From the initial average
of 4.4% of the expenditure in 2000, 2.3% of expenditure was used for paying the
interest in 2014. This decline can be explained by the lower interest rates nationwide,
better loan contracts, and extended payment deadlines, which together had a positive
impact on the debt issues. It is also worth highlighting the case of Roraima,
the only state to achieve a score of 1 (2002). This grade might be interpreted
as a data error or even as a refusal to paying interests, given the fiscal
condition of the state. However, Roraima had the second-best average
score on this criterion analysis, with an average of 0.9878 and standard
deviation of 0.0078, which makes the score reasonable.
The ratio of current net
debt to current net revenue of the states revealed great dispersion and high incidence
of minimum scores. These results indicate that the state debts should receive immediate
attention and action by the government planners. In the sample, 9 out of the 27
states exceeded the upper limit, including Mato Grosso, which surpassed
the limit only in 2000, and Rio Grande do Sul, which
did not reach the limit even once within the considered period.
However, results revealed
that, in general, the states have managed to reduce the ratio of debt to current
net revenue. All considered, the mean scores showed consistent improvement from
0.36 in 2000 to 0.65 in 2014. This fact raises the question whether the increase
in the debt-income ratio was more influenced by the growth in revenues rather than
by the decrease in debt. A brief analysis of the data shows that the revenues
increased faster than debt. This evidence is also consistent with findings that
states are now reducing the payment of interests, and that more recent
contracts have new deadlines, postponing the payments, but generating an
increasing future debt.
Equally weighted, the
two axes of the debt revealed no significant changes in the results observed in
each of its divisions. With regards to the joint analysis, it is worth
highlighting that the state of Rio de Janeiro has got the
second -and third- worst scores (0.4635 in 2002, and 0.4637 in 2003) of the
sample, but it was not among the states with the lowest average of indebtedness.
This fact occurred due to recurring scores higher than 0.5234 as of 2007
(including a maximum of 0.6132 in 2011), which considerably raised the average
value and resulted in a striking development in the recent years.
Regarding the planning
accuracy, the fourth dimension, Brazilian states got an average of 89.15% in
predicting the revenues. This value is slightly lower than the 90.13% accuracy
in planning the spendings, showing a balance inherent in the planning stages.
However, the revenues
and expenses observed got an average accuracy of 94.87%, revealing a higher assertiveness
in the execution steps, when compared to the planning stages. This verification
therefore reaffirms, at the subnational level, the hypothesis of greater managerial
freedom of the executive power to carrying out budgetary expenditures for both
cases of inaccuracy. Whether or not the revenues exceed the planned values, the
executive is allowed to increase the budget for existing expenses. If the government
faces insufficient income, discretionary cuts in expenditure can also be made
without prior legislative approval.
As for the last
dimension, the constitutional requirements for allocation were evaluated. For
this procedure, we used two sub-scores: one for education and another for
health funds. The minimum percentage allocated for education, in general, got an
average score in the order of 0.8120 for the states, with a deviation of
0.1483. Therefore, although the states usually do not meet the legal provision,
the high deviation denotes a wide variation within the sample. This result is
corroborated by the difference between the lowest and the highest averages of
the states. The states that showed the lowest average scores were Espírito
Santo (0.4171), Pernambuco (0.4786), and Mato Grosso
(0.6142). Espírito Santo was also responsible for two of the
three smallest annual allocations, getting a score of 0.4626 in 2011, and 0.44
in 2012. The highest score of 1 was obtained by 22 federative units at least
once, and the states of Ceará, São Paulo, Paraná, Amapá,
and Distrito Federal achieved the maximum annual grade at least five times
during the period assessed (11, 10, 8, 7, and 5 times, respectively).
The minimum application in
health resources showed superior results compared to those recorded in education.
All federal units obtained the maximum score at least once, and six of them (Acre,
Alagoas, Bahia, Distrito Federal, Paraná, and Rio
Grande do Norte) fulfilled the requirement throughout the
entire period assessed.
Two factors may explain
the difference between the minimum percentages. First, the mutual responsibility
of the different levels of contribution with the basic education, as determined
by the Brazilian law. The state-level government is not the only formally
responsible for providing and assuring quality in public schools. Therefore,
the low quality of the services offered due to the lack of resources might be
obscured by the responsibility shared with municipalities and the Federal
Government. Second, the obligatory expenditure percentage set for education is
much higher than that established for health (25% against 12%), which creates a
severe restriction, especially for states that have high costs with salaries and
debt interests.
With the results of the
minimum constitutional investments in education and health equally weighted,
the federative units of São Paulo, Acre, and Amapá showed
the highest average scores (0.9800, 0.9784, and 0.9707, respectively). Notwithstanding,
Ceará was the state that obtained the maximum score more times because
it met these minimum resources health and education for in 11 out of the 15 years
possible. The states with the worst average scores were Espírito Santo
(0.7651), Pernambuco (0.7856), and Mato Grosso (0.7926).
In addition, nine other states did not obtain the maximum score even once
during the evaluation period.
The overall results
reveal that considerable improvements were made outside the south and southeast
regions of Brazil. In this sense, Maranhão, Pernambuco, Goiás,
Paraíba, and Amazonas have accomplished the most in these fifteen
years. It is also worth mentioning that the enhancements are numerically more
significant than the decays. On one side, the states of Maranhão and Pernambuco
had increased 0.22 and 0.13 respectively; whereas Minas Gerais
and Acre got grades in 2014 worse than they did in 2000, with -0.048 and
-0.046, respectively.
The year 2010 revealed
itself as a turning point for most of the state governances, and it strongly affected
the economic scenario as a whole. Two explanations are possible for this
conundrum. The first one is the apex of the economic boom in Brazil, which made
it possible for the states to take advantages and improve their performance.
The second explanation is the end of the electoral cycle, with general
elections taking place in October 2010, and the elected politicians assuming
their position in January 2011. Unfortunately, the precise intensity of these
factors will have to be determined in future studies, due to the lack of a
longer series for analysis.
After assessing the governance
intensity, the scores were weighted by the population of each state to provide
the governance incidence. Table 3 shows that the first year of the series,
2000, holds the lowest value for governance incidence in the interval assessed.
This fact occurred mostly because of the extremely low debt scores, and the low
values of health and education allocations. In the following year, 2001, the
worst criteria for the states changed. Planning accuracy was even worse than
the constitutional requirements for financial allocation to education and health.
Meanwhile, the debt still got the lowest grade considering the states
altogether; it was even lower than in 2000.
Table 3
– Governance incidence weighted by the population of the Brazilian states in 2000-2014
|
Year
|
Population-weighted scores
|
|
Governance
incidence
|
Score A
|
Score B
|
Score C
|
Score D
|
Score E
|
|
2000
|
0.8681
|
0.9862
|
0.9934
|
0.5841
|
0.9077
|
0.8693
|
|
2001
|
0.8847
|
0.9881
|
0.9963
|
0.5711
|
0.9174
|
0.9507
|
|
2002
|
0.8797
|
0.9916
|
0.9958
|
0.5552
|
0.9332
|
0.9227
|
|
2003
|
0.8812
|
0.9795
|
0.9995
|
0.5693
|
0.9385
|
0.9193
|
|
2004
|
0.8807
|
0.9893
|
1.0000
|
0.5868
|
0.9384
|
0.8888
|
|
2005
|
0.8853
|
0.9882
|
1.0000
|
0.6129
|
0.9441
|
0.8813
|
|
2006
|
0.8836
|
0.9493
|
1.0000
|
0.6372
|
0.9438
|
0.8875
|
|
2007
|
0.8900
|
0.9534
|
1.0000
|
0.6698
|
0.9387
|
0.8881
|
|
2008
|
0.8991
|
0.9777
|
1.0000
|
0.6965
|
0.9261
|
0.8951
|
|
2009
|
0.9135
|
0.9905
|
1.0000
|
0.7123
|
0.9455
|
0.9192
|
|
2010
|
0.9065
|
0.9918
|
1.0000
|
0.7173
|
0.9321
|
0.8910
|
|
2011
|
0.9117
|
0.9885
|
1.0000
|
0.7346
|
0.9325
|
0.9026
|
|
2012
|
0.9088
|
0.9927
|
0.9900
|
0.7315
|
0.9359
|
0.8938
|
|
2013
|
0.8985
|
0.9884
|
0.9899
|
0.7383
|
0.9004
|
0.8754
|
|
2014
|
0.8958
|
0.9802
|
0.9838
|
0.7286
|
0.9158
|
0.8705
|
The subsequent years,
2001-2002, showed considerable improvement on the grades achieved, as shown in
Table 3. As a clear effect of the enactment of the Fiscal Responsibility Law,
the states increased their average scores in four out of the five dimensions
under analysis. The improvements, however, were not enough on the debt
dimension, which was still critical for the states’ performance during the entire
evaluation.
Testing of reliability and
validity
The indicator we now
propose holds a strong internal consistency, as shown in Table 4. We verified
positive correlations with all components individually, with a significance of 0.001.
This result implies that all components were relevant for the indicator as a
whole, as stated by the positive signal. Furthermore, two positive correlations
were found within the indicator dimensions. First, a weak positive correlation was
noticed between the current balance and the debt dimensions. In this case, further
works should check the causality direction, but it is theoretically and
empirically expected that a negative imbalance causes debt to increase.
Our results showed a
second positive correlation between the debt and minimum allocation in
education and health. In spite of this correlation being less significant
(0.05), governments should not neglect the harmful effects of the potential
trade-off between these two dimensions, since poor debt management can compromise
the obligations with the social policy in these areas. An alternative to
overcome this danger would be to enact mechanisms that ensure this minimum allocation,
even in high debt scenarios.
Table 4 - Correlation matrix: internal consistence
|
Intensity
|
A Scores
|
B Scores
|
C Scores
|
D Scores
|
E Scores
|
|
Intensity
|
1
|
|
|
|
|
|
|
A Scores
|
0.24***
|
1
|
|
|
|
|
|
B Scores
|
0.17***
|
-0.05
|
1
|
|
|
|
|
C Scores
|
0.83***
|
0.02
|
0.19***
|
1
|
|
|
|
D Scores
|
0.23***
|
0.04
|
-0.03
|
-0.09
|
1
|
|
|
E Scores
|
0.50***
|
0.05
|
-0.01
|
0.11*
|
-0.06
|
1
|
For the years 2004-2009,
the IGEB, developed by Miranda (2012), was used to establish a comparison,
while for 2010, we chose the IGovP, developed by Oliveira and Pisa (2015), was
taken as a reference. According to the results displayed in Table 5, the GI showed
a negative correlation with both of these indicators in Brazil, for the entire
duration of the assessment. The most extreme value of this correlation was
found with IGovP, which is consistent with our findings due to the lack of
quantitative reliability tests in the studies of Oliveira and Pisa (2015).
Table 5 - Correlation between GI and the previous governance
indices of the Brazilian states
|
Year
|
|
|
IGEB
|
IGovP
|
|
Correlation GI – Other indicators
|
2004
|
2005
|
2006
|
2007
|
2008
|
2010
|
|
-0.1557
|
-0.3082
|
-0.2981
|
-0.2976
|
-0.2579
|
-0.4321
|
Thus, the plotted
indicators and the GDP per capita revealed distinct patterns. Figure 1 presents
the results for GI in black dots, which do not have a clear correlation with
the GDP. However, the red dots representing the results of IGEB and IGovP exhibit
a clear upward trend as the GDP increases. If the values on the extreme right
of the plot had been considered, this trend would have been even more evident.
Figure 1-Governance grades and GDP
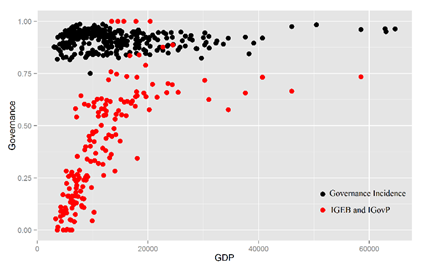
The correlation values of
both groups reaffirm this evidence, as our indicator does not have a relevant
correlation with the GDP, showing a -0.07 value for the whole sample. On the
other hand, previous attempts have never found any annual correlating values below
0.70, or a mean correlation of 0.73 with the state GDP in the entire sample. In
other words, it should not be surprising that our results were so different
from the preceding ones, since the previous concept of governance essentially measured
just wealth.
Several considerations
arise from this difference. First, there is vast empirical evidence that
challenges IGovP and IGEB constructions as attempts to measure subnational governance.
In this sense, the choice of secondary indicators that led to an income-based
result could have widened the scope of governance to the point that the wealth
inequality condition in Brazil became evident through the analysis. Thus, our
choice to focus on public financial primary indicators became more independent
from inequality, establishing a new cutoff point between wealth and governance.
Second, it is possible
that a relation between wealth and governance, as wealthier governments are
more likely to have available resources to tackle governance issues. However,
the contrary is not valid, because poor governments do not have the same condition
due to the lack of governance requirements. Even in the wide scope of
governance assumed by IGEB and IGovP, the reality proves the opposite. Since none
of the Brazilian states have completely fulfilled the legal requirements for
public finance, we can speculate that some of them might be in worse condition
than others, and that the states that performed better did not do so by
increasing GDP.
Conclusions
This work presents the
formulation of a financial governance indicator for Brazilian states, by
establishing the theoretical weighting criteria and the corresponding grades, from
2000 to 2014. Despite the wide range of governance indicators that proliferate
every year, this one stands out for determining exclusively normative criteria,
based on an existing legal framework. Its potential application includes the
immediate use by the public administration as an instrument of verification, providing
citizens with an assertive mechanism for monitoring the government’s
performance, with nationally relevant specifications (Hood, 2012), and extensive
theoretical utilization in federal states.
The use of nationwide
stable updated criteria for measuring governance made possible its backward verification,
from the then current year to the implementation of the Fiscal Responsibility
Law in Brazil, thus building a consistent gap-free database of 15 years.
It would be possible to
establish a ranking of the states according to the scores they got. However, we
understand that such classification system does more harm than good, as the assignment
of relative positions might promote erroneous readings of relative success in the
face of a backdrop of poor general conditions. Thus, the scores were kept
according to the original grades, positively varying between 0 and 1, and the
possible ranking system was ignored.
The proposed indicator
led to results different than those of previous researches, which sought an
indicator for public governance, such as IGEB (Miranda, 2012) and the IGovP
(Oliveira and Pisa, 2015). Two factors caused this discrepancy. First, the
incorporation of variables not related to wealth. This choice was made due to criticism
on the use of GDP for the public sector performance analysis, either absolute
or weighted by population. The incorporation of GDP is not representative of the
government performance and may distort or mask results in inequality scenarios
(Tanzi, Schuknecht, 2000; Stiglitz, 2012; Atkinson, 2015). Thus, our evidence
shows that the distribution of the best results is barely correlated to the availability
of financial resources - typically in southeastern and southern states – as found
by previous works.
As an extension of the evidence
found, the adequacy of the proposed criteria for the conditions of the state
finances is beyond the scope of this study. Aspects such as the redesign of the
federal pact, the revision of the minimum constitutional percentages for social
expenditure, or the analysis of state revenue sources, though not yet addressed,
are intrinsically associated with this topic, and have crucial contributions to
further studies on subnational public finance in Brazil.
As restrictions of this
research, two factors must be taken into account. First, the complete lack of reliable
information concerning the real value of wages paid by the public sector made it
impossible to evaluate the performance of the fiscal responsibility law regarding
personnel expenditure. Second, the absence of a database on state budgets in
Brazil, which may cause some information to be unavailable in the future, or
dependent on the commitment of civil servants and politicians. So far, all the
information was open to the public, immediately or upon request. Therefore, we
hope that the Brazilian federal government will make the financial information accessible
in a more systematic format, in order to avoid inconsistencies due to the need for
searching through different databases throughout the years.
Another possible
extension of this article is the investigation of whether other developing
countries, with analogous administrative divisions, such as Mexico or Colombia,
also have similar legal requirements for subnational governments.
As a final remark, it is
relevant to mention that this research does not have tendencies towards any political
party, association or governmental plan. We do not propose a chase for an
optimal solution, but an a posteriori analytical tool to evaluate the
public sector performance. Finally, we also affirm that there are no existing
or potential conflicts of interest that would compromise the publication of
this study or future researches.
References
Alford, J.; O’Flynn, J. (2008). Public Value: A Stocktake of a Concept.
Twelfth Annual Conference of the International Research Society for Public
Management. Risbane: International Research Society for Public Management.
Alkire S, Foster J, Seth S, Santos MA, Roche JM, Ballon P. (2015).
Multidimensional Poverty Measurement and Analysis. Oxford: Oxford University
Press.
Atkinson A.J. (2015). Inequality: What Can Be Done? Cambridge:
Harvard University Press.
Atkinson AJ, Waterhouse JH, Wells RB. (1997). A stakeholder
approach to strategic performance measurement. Sloan Management Review, 38
(3), 25-37.
Bevir, M. (2010). Governance as Theory, Practice and Dilemma. In: The
Sage Handbook of Governance. Thousand Oaks: Sage.
Blaug R, Horner L; Lekhi R. (2006). Public value, politics and
public management. London: The Work Foundation.
Bozeman B. (2002). Public Value Failure: When Efficient Markets
may not do. Public Administration Review, 62 (2), 145-161.
Bozeman, B. (2007). Public Value and Public Interest:
Counterbalancing economic individualism. Washington: Georgetown
University Press.
Brasil.
Constituição da República Federativa do Brasil de 1988. Available
in: http://www.planalto.gov.br/ccivil_03/constituicao/constituicaocompilado.htm
Brasil.
1964. Lei nº 4320/1964. Diário Oficial da União, 04/05/1964.
Brasil.
2000, Emenda Constitucional nº 29. Diário Oficial da União, 14/09/2000.
Brasil.
2001. Resolução do Senado Federal nº 40/2001.Diário Oficial da União, 21/12/2001.
Brennan G, Buchanan JM. (1980). The Power to Tax: Analytical
Foundations of a Fiscal Constitution. Cambridge: Cambridge University
Press.
Chan JL., Xiao X. (2009). Financial Management in Public Sector
Organizations. In: Bovaird T, Loffler E (eds.). Public Management and
Governance, 2.ed. London: Routledge.
Chow CW, Ganulin D, Haddad K, Williamson J. (1998). The balanced
scorecard: a potent tool for energizing and focusing healthcare organization
management. Journal of Healthcare Management, 43(3), 263-280.
Constable S, Passmore E, Coats D. (2008) Public value and local
accountability in the NHS. London: The Work Foundation.
Decanq, K., Lugo, M.A. (2008) Setting Weights in Multidimensional
Indices of Well-Being and Deprivation. OPHI Working Paper n.18. Oxford: Oxford
Department of International Development.
Feldman M; Khademian AM. (2002). To Manage Is to Govern. Public
Administration Review, 62(5), 529–541.
Hobbes, T.(1998). The Leviathan. Oxford: Oxford University Press.
(Original work published 1651)
Hood, C. (2012). Public Management by Numbers as a
Performance-Enhancing Drug: Two Hypotheses. Public Administration Review,
72(S1), 585-592.
Jørgensen TB, Bozeman B. 2007. Public Values: An Inventory.
Administration & Society, 39(3), 354-381.
Kaufmann D, Kraay A, Mastruzzi M. (2011). The Worldwide Governance
Indicators: Methodology and Analytical Issues. Hague Journal on the Rule of
Law, 03 (2), 220-246.
Matthews F. (2012). Governance and State Capacity. The Oxford
Handbook of Governance, 281-293. Oxford: Oxford University Press.
Meynhardt, T. (2009) Public Value inside: what is public value
creation? International Journal of Public Administration, 32(3),
p.192-219.
Mikesell JL, Mullins DR. (2011). Reforms for Improved Efficiency
in Public Budgeting and Finance: Improvements, Disappointments, and
Work-in-Progress. Public Budgeting and Finance 31(4),1-30.
Miranda,
R.A. (2012). Governança: Um Índice para as Unidades Federativas Brasileiras (PhD
Thesis). Belo Horizonte: UFMG.
Modell S. (2004). Performance Measent Myths in the Public Sector:
A research note. Financial Accountability and Management, 20 (1),
39-55.
Moore MH. (1995). Creating Public Value: Strategic management
in government. Cambridge: Harvard University Press.
Moore MH. (2003). The Public Value Scorecard: A Rejoinder and an
Alternative to Strategic Performance Measurement and Management in Non-Profit
Organizations' by Robert Kaplan. Hauser Center for Nonprofit Organizations Working
Paper 18.
O’Donnell G. (2004). The Quality of Democracy: Why the Rule of Law
Matters. Journal of Democracy. 15(4), 32-46.
OECD, Organization for Economic Cooperation and Development. (2005). Modernising
Governance. Paris: OECD.
Oliveira,
F.A. (2009). Economia e política das finanças públicas no Brasil: um
guia de
leitura.
São Paulo: Hucitec.
Oliveira
AG, Pisa BJ. (2015). IGovP: índice de avaliação da governança pública -
instrumento de planejamento do Estado e de controle social pelo cidadão.
Revista de Administração. Pública, 49(5): 1263-1290.
Peters,
BG. (2012). Governance as Political Theory. In: Levi-Faur, D. The Oxford
Handbook of Governance, 19-32. Oxford: Oxford University Press
Rubin, M.M. Willoughby, K. (2009) Financial Management Grades for
the States: A Prospective Use. Public Budget and Finance, 29(1),
49-67.
Rutgers M.R. (2015). As Good as It Gets? On the Meaning of Public
Value in the Study of Policy and Management. American Review of Public
Administration, 45(1): 29-45.
Stiglitz, J. (2012). The Price of Inequality: How Today's
Divided Society Endangers Our Future. New York: W.W. Norton Company.
Stoker, G. (2006). Public Value Management: A New Narrative for
Networked Governance? The American Review of Public Administration, 36(1)
41-57.
Tanzi, V. (2008). The Role of the State and Public Finance in the
Next Generation. OECD Journal on Budgeting, 8(2): 1-27.
Tanzi V, Schuknecht L. (2000). Public Spending in the 20th
Century: A Global Perspective. Cambridge: Cambridge University Press.
Zumbansen P. (2012). Governance: An Interdisciplinary Perspective.
In: The Oxford Handbook of Governance. Oxford: Oxford University Press.
The full
list of the budget laws with the numbers and enactment dates is available upon
request.